Digital Transformation | May 2026

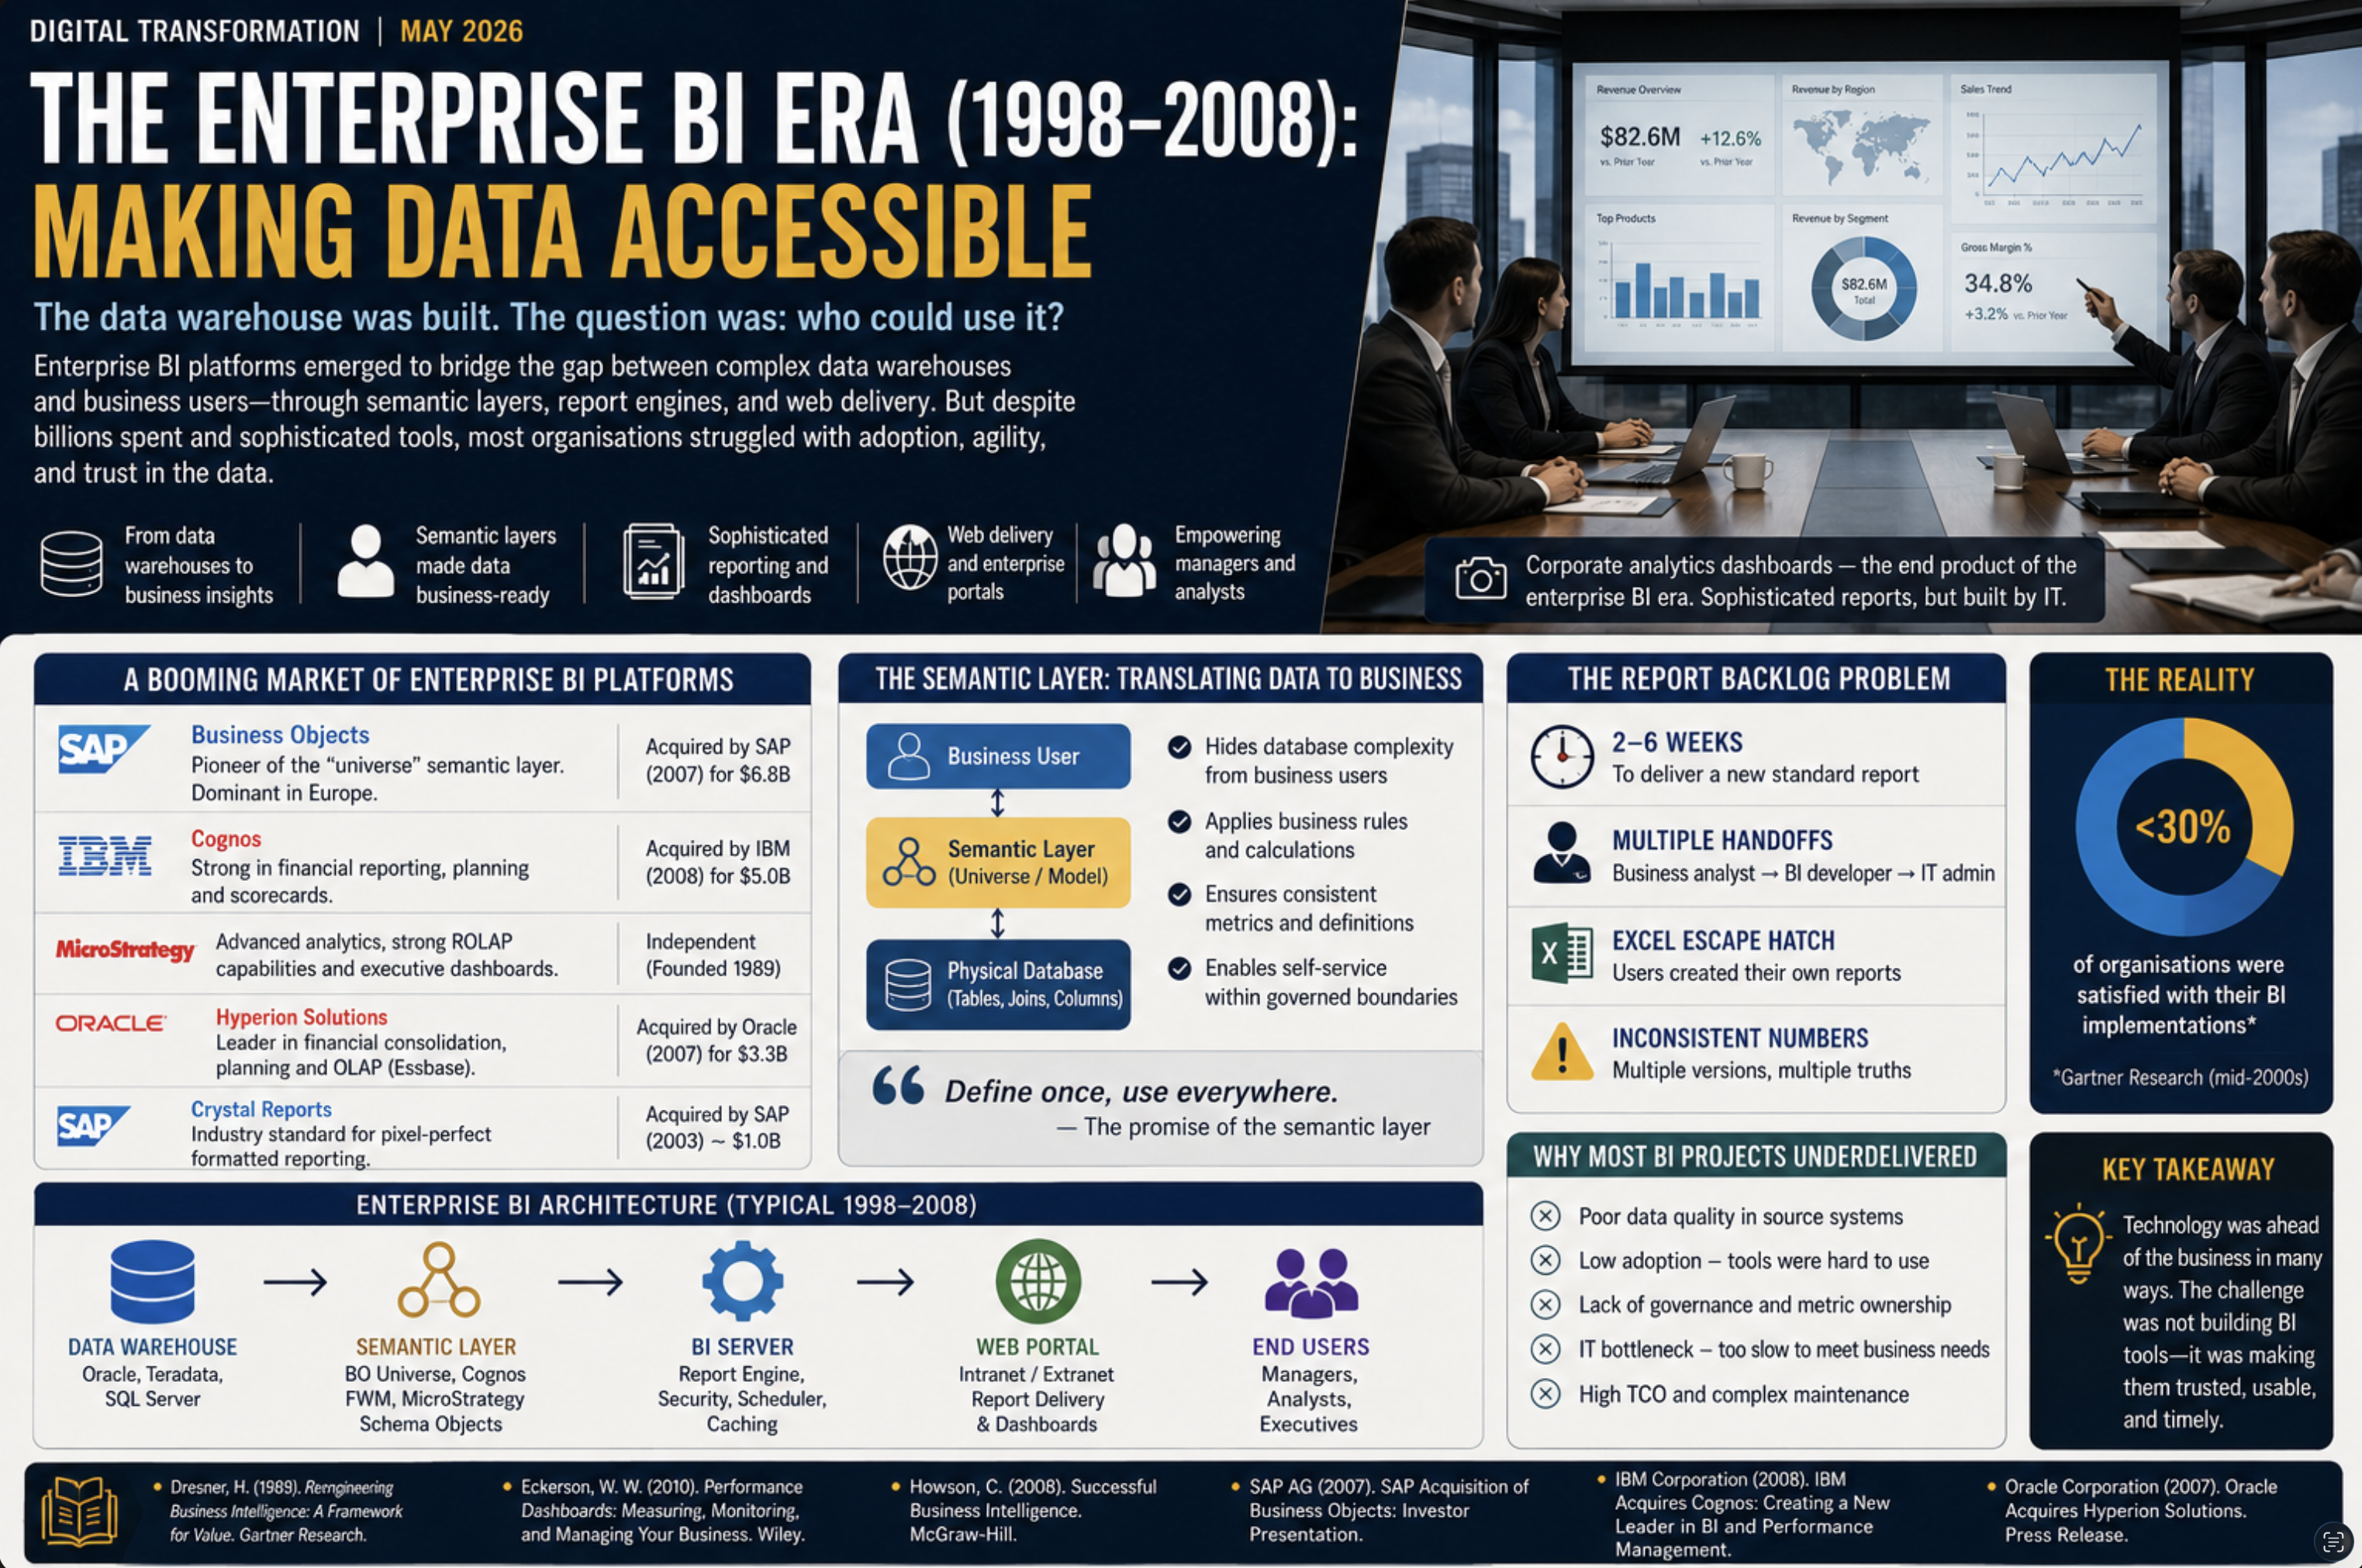
By the late 1990s, every large enterprise had a data warehouse. Whether it worked whether it produced numbers that people trusted, that decisions were actually made from, that justified the seven-figure implementation costs was a different question. The data warehouse had been built. The question was who could use it.
The answer, for most of the period from 1998 to 2008, was: IT. Analysis required SQL expertise, understanding of the physical data model, knowledge of which tables contained which data and how they related. Business users could not access the warehouse directly. They could submit report requests to the BI team and wait. They could work from spreadsheets built by IT. Or they could buy something.
The something they bought was enterprise Business Intelligence software and the market that emerged to sell it became one of the most lucrative in enterprise technology history.

The Market Takes Shape
The enterprise BI market of the late 1990s and 2000s was dominated by a small number of large platforms. Each attempted to provide a complete, integrated suite query and analysis tools, a metadata layer abstracting the physical database, a reporting engine, a scheduling and distribution system, and a web delivery portal on top of whatever data warehouse the enterprise had built.
Business Objects, a French company founded in 1990, introduced the “universe” concept a semantic layer that translated the physical database schema (tables, joins, columns) into business terms (Customer, Revenue, Product Category) that analysts could use without SQL knowledge. Business Objects became the dominant BI platform in European enterprises through the mid-2000s and was acquired by SAP for $6.8 billion in 2007.
Cognos, a Canadian company, took a strong position in financial reporting and planning. Its PowerPlay OLAP tool and Impromptu query tool were widely deployed in finance departments through the 1990s. IBM acquired Cognos in 2008 for $5 billion.
MicroStrategy, founded by Michael Saylor in 1989, built a technically sophisticated platform with strong ROLAP capabilities. It was an early leader in web-delivered reports and executive dashboards and remains an independent company focused on enterprise analytics and, more recently, Bitcoin holdings.
Hyperion Solutions formed through the merger of Arbor Software (Essbase OLAP) and IMRS (now Cognos planning) owned the financial consolidation and planning market before being acquired by Oracle in 2007 for $3.3 billion.
Crystal Reports, originally a desktop report writer, became the standard for pixel-perfect formatted output invoices, statements, regulatory filings and was embedded in dozens of third-party applications. SAP acquired Crystal Decisions (the parent company) in 2003 for approximately $1 billion.

The Semantic Layer: Abstracting the Database
The defining architectural innovation of the enterprise BI era was the semantic layer a business-oriented metadata model sitting between the physical database and the analytical tools. In Business Objects, this was the “universe.” In Cognos, the “Framework Manager model.” In MicroStrategy, the “schema objects” and “public objects” layers.
A well-designed semantic layer allowed a non-technical analyst to drag and drop business terms into a query builder and receive correct, consistent results without writing a line of SQL. The semantic layer handled the join logic (which tables needed to be joined, and on which keys), the business rules (which filter to apply to exclude cancelled orders from revenue figures), and the metric definitions (revenue = sum of order lines where order status = completed and recognition date falls in the reporting period).
This was the first serious attempt at what would later be called the “semantic layer” or “metrics layer” the idea of defining business logic once, centrally, and making it available to any consumer. The enterprise BI platforms got the concept right but made a critical mistake: they locked it inside proprietary tools. A Business Objects universe could not serve a Cognos report or a MicroStrategy query. Each platform had its own walled garden.
The Report Backlog Problem
The most persistent operational problem of the enterprise BI era was the report backlog. Building a new report required: a business analyst to specify requirements, a BI developer to build the underlying SQL or semantic layer query, an IT administrator to schedule and deploy the report, and a user acceptance testing cycle before production deployment. For a standard management report, this process took two to six weeks.
Business users who needed data urgently to support an operational decision, to respond to a customer query, to prepare for a board meeting could not wait six weeks. The response was predictable: they built their own reports in Excel. Excel became the universal escape valve from enterprise BI. Data was extracted from the warehouse (often by IT, who wrote ad-hoc queries), pasted into spreadsheets, and distributed via email. Versions proliferated. Figures diverged. The “single version of truth” the data warehouse had been built to provide became multiple conflicting spreadsheet versions.
🏗️ Architecture: Enterprise BI Architecture (1998–2008)
Data Warehouse
(Oracle, Teradata,
SQL Server)→🗺️
Semantic Layer
(BO Universe,
Cognos FWM)→📊
BI Server
(Report Engine,
Scheduler)→🌐
Web Portal
(Intranet
Delivery)→👥
End Users
(Managers,
Analysts)
Why Most BI Projects Underdelivered
Gartner research through the mid-2000s consistently found that BI project satisfaction rates were below 30% that is, fewer than a third of organisations implementing enterprise BI reported that the implementation had delivered the expected value. The reasons were consistent across industries and geographies.
Data quality: The warehouse contained inconsistent, incomplete, or incorrect data inherited from the source systems. No semantic layer or reporting tool can produce trustworthy output from untrustworthy input. Data quality was treated as an IT problem; it was fundamentally a business governance problem that technology alone could not solve.
Adoption failure: Enterprise BI tools required training. Users who found the tools difficult reverted to familiar tools Excel, Access, paper reports rather than climbing the learning curve.
Governance failure: When two reports gave different figures for the same metric, users lost trust in both. Without clear governance over metric definitions, report certification, and data lineage, the “single version of truth” became an aspiration rather than a reality.
IT bottleneck: The report development process was too slow for operational decision-making. Users needed data in hours; the process delivered it in weeks.
The self-service BI revolution discussed in Part 11 was a direct response to these failures. But before self-service could emerge, the entire industry would be disrupted by a challenge of a different kind: data volumes that no enterprise warehouse, however well designed, was built to handle.
References
- Dresner, H. (1989). Reenginering Business Intelligence: A Framework for Value. Gartner Research.
- Gartner Research (2007). Magic Quadrant for Business Intelligence Platforms.
- Eckerson, W. W. (2010). Performance Dashboards: Measuring, Monitoring, and Managing Your Business. Wiley.
- Howson, C. (2008). Successful Business Intelligence. McGraw-Hill.
- SAP AG (2007). SAP Acquisition of Business Objects: Investor Presentation.
- IBM Corporation (2008). IBM Acquires Cognos: Creating a New Leader in Business Intelligence and Performance Management.
- Oracle Corporation (2007). Oracle Acquires Hyperion Solutions. Press Release.